If the computer suddenly shuts down, freezes or slows down while performing complex tasks, the reason may be overheating of the processor. When overclocking, it is critically important to monitor the temperature of its cores..
Surprisingly, Windows doesn't have a built-in tool to monitor CPU heating. For the sake of this information, you can go into the BIOS, but isn't it a lot of hassle for the sake of a simple sensor reading? Fortunately, there are several free programs that can do this. You can monitor the heating of the processor in Windows without restarting the PC or entering the BIOS.
INTEL XTU
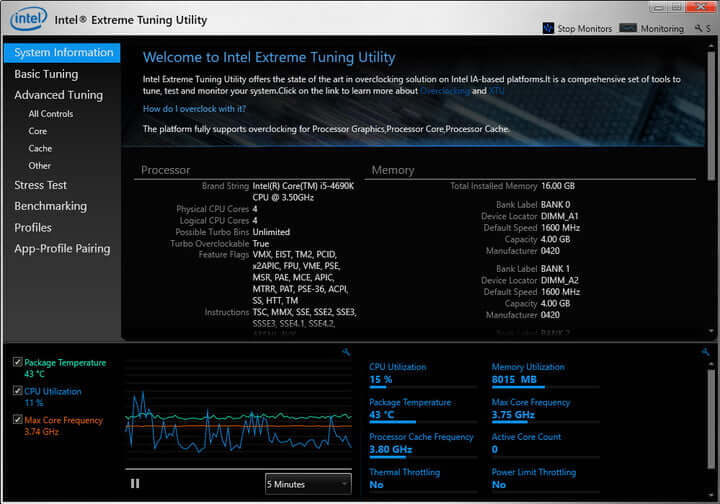
If you have an Intel Core processor, the best way to monitor CPU heat is by using the Intel Extreme Tuning Utility (XTU) . And although this utility is positioned as an overclocking tool ("overclocking"), it also does an excellent job of monitoring temperatures..
You will see a lot of useful information when you launch the application, but the most important data about your CPU is displayed in the bottom pane of the main window. In our case, the package temperature item and the associated graph are of particular interest.
The processor utilization as a percentage is shown in the CPU Utilization item. If you want to know how it copes with the maximum load, use the built-in benchmark - performance test (tab on the left side of the main window)..
AMD RYZEN MASTER
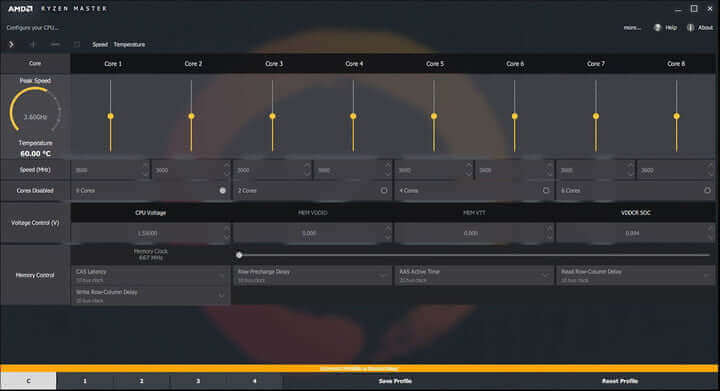
If you have AMD Ryzen, use the original manufacturer's tool, AMD Ryzen Master . It works on the same principles as Intel XTU, only it is designed for overclocking, testing and monitoring Ryzen processors.
In addition to the ability to change the clock frequency of the processor, the utility also monitors its temperature. You can see this data on the left side of the main window. Like the XTU, the AMD Ryzen Master graphs its level over time. Heating of each individual core can also be demonstrated. Ryzen Master can produce average and peak values, which makes it possible to track their change over certain periods of time under heavy load.
Note: unlike most Intel chips, "red" AMD displays two temperature readings - CPU Temperature and Core Temperature. The first is the actual temperature of the chip clamped in the socket. The second - even if measured in degrees Celsius, in a sense, only an imitation.
As a rule, the BIOS displays CPU Temperature, which is perceived differently by different utilities. Core Temp, for example, refers to this as "core temperature". CPU Temperature is more accurate at low values, less accurate at high values. Core Temperature - on the contrary, more precisely, when the processor is loaded to the eyeballs.
Cam by NZXT
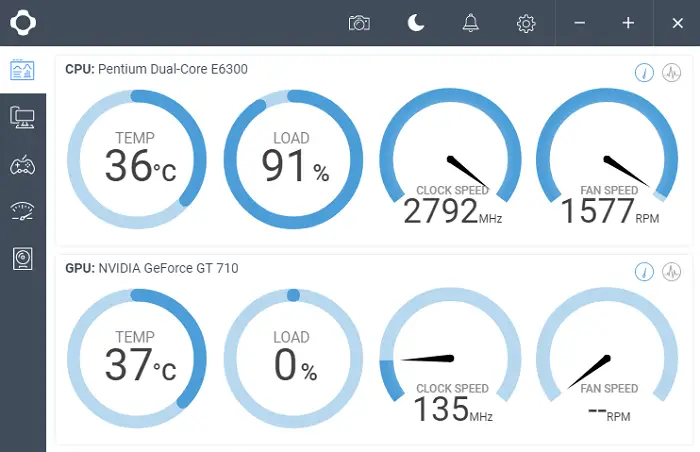
Cam by NZXT is a popular utility with great features. On a cursory acquaintance, its interface seems more intuitive than most other similar programs. It shows all sorts of useful information about the CPU, video card, RAM and hard drive. There is also a frame rate overlay for gaming and built-in overclocking tools. You can even use the Cam mobile app to stay on top of your performance while away from your PC.
Note that if you have an AMD Ryzen system (including second generation models such as the Ryzen 7 2700X), you may see two different numbers. You need "Tdie" - the real temperature of the CPU. Alternative - "Tctl" - this is offset (higher than the actual heating of the chip), on which the cooling system is based. Those programs that give one indicator, in fact, show "Tctl", which is not entirely correct.
HWMonitor
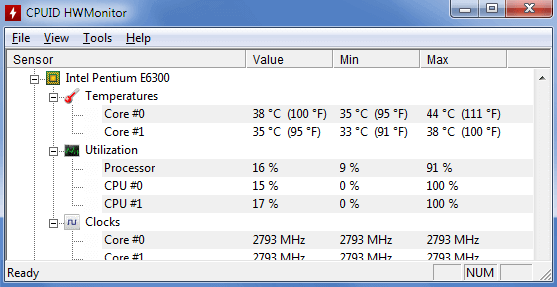
In general, CPU heating is the most important temperature indicator of a computer. But if you want to be aware of the heating of all components of the system unit - motherboard, video card, hard drives, then use the HWMonitor program .
HWMonitor will tell you a lot about the various components of your system, from the voltage they consume to the temperatures at which they operate. The program has a simple interface, is not overloaded with unnecessary functionality and is not intended for overclocking.
To find the CPU temperature, scroll down to the line with the name of your CPU and find the Temperatures block listing the cores (Core # 0, and so on). Important clarification: in HWMonitor, the "Core Temperature" and "CPU Temp" parameters are different. On some PCs, "CPU Temp" may be shown in the motherboard section.
Core Temp
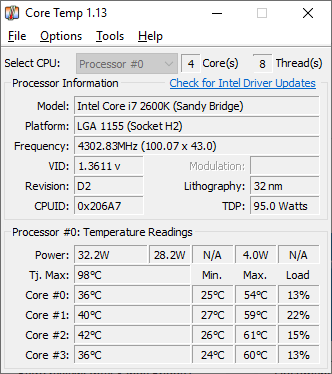
The fastest and easiest way to check CPU heating is to use the aptly named Core Temp program , but be careful when installing it! Like many free utilities, it will try to install adware unless you uncheck a few checkboxes during installation.
After the application is installed, a window will open and you will see information about the current state of the processor, including the average temperature. If you only need this indicator for each core, then you will see it in the system tray.
Overheating protection is provided here - you can activate it to get a warning when heating becomes critical. At the same time, Core Temp can automatically turn off the computer, put it into sleep mode or hibernation.
The application has a number of other functions: displaying the maximum allowable CPU heating, the ability to view its load, changing the temperature update interval, and others.
SpeedFan
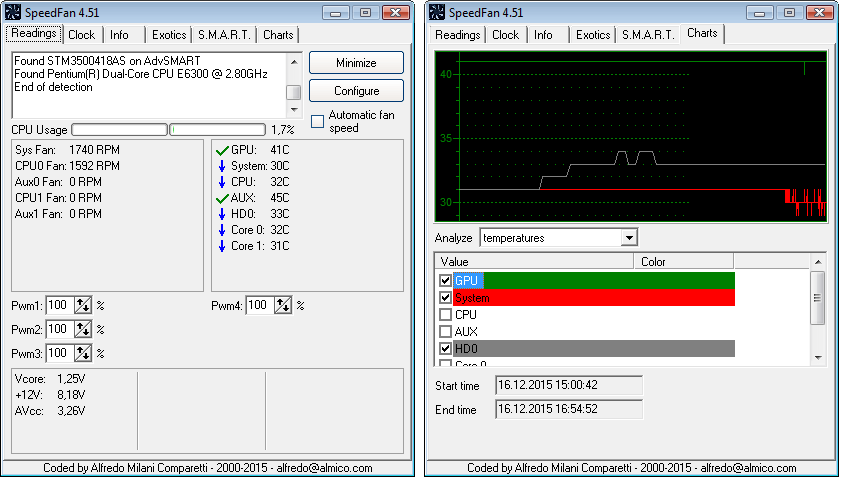
SpeedFan is a program that monitors voltage, fan speed and temperature. It can show the heating of the hard drive, and it also supports SCSI drives. It can even change the FSB on some hardware, gain access to digital thermal sensors and change the fan speed, reducing the noise level.
By setting it correctly, you can change the fan speed depending on the heating of the system. When choosing parameters for the minimum and maximum speed, try setting them manually - uncheck all VARIATE FANs and listen to the noise. When you cannot hear it, you can set this value as the minimum rotation speed. I suggest using 100 as the maximum value, if there is a lot of noise from it, then you can reduce the maximum speed to 95 or 90.
What is the normal temperature?
The maximum allowable values vary depending on the processor model. Most of the free apps mentioned above indicate the maximum allowable value as Tj.Max, which stands for temperature junction.

If for some reason you cannot find this information, go to the CPU World website and find your CPU there. Each of these programs defines the processor model, so finding the information you need is as easy as shelling pears.
It is worth remembering that the maximum temperature is the limit at which the processor shuts down to avoid damage. Regular operation under the threat of overheating will negatively affect the life of the chip. Here's a simple rule of thumb to help extend the life of your computer:
- Up to 60 ° C: Everything is good! You don't have to worry.
- 60 ° C to 70 ° C: Still good, but getting a little hotter. Consider cleaning your computer from dust.
- 70 ° C to 80 ° C: This is more than is necessary for the job, unless you are overclocking. If not, then it is definitely worth checking the fans to make sure they are working properly and the airflow is not obstructed by clumps of dust.
- 80 ° C to 90 ° C: Too much for continuous operation. Check if the fans are broken or there are no accumulations of dust, and if you did overclocking, go back to the old settings - especially the voltage if you touched it. One exception: sometimes we see powerful laptop processors crossing the 80 ° C threshold during gaming sessions while plugged in, after which throttling (forced performance limiting) is triggered. This is to be expected and is worth worrying about above 85 °.
- Above 90 ° C: Dangerous! It is better to turn off the computer.
overheat protection
Modern processors are intelligently designed - when they reach high temperatures, the risk to "hardware" is small. If the heat really gets high, the overall performance is simply limited, so it's better to get a good cooler. However, the situation can get out of hand if you have an overclocked chip (from Intel with index K) and you decide to manually set the voltage and frequency in the BIOS. In this case, you can actually damage the motherboard.
Fortunately, Core Temp has an overheating protection feature. In the settings, check the Enable overheat protection checkbox and select one of the three options. By default, you will receive a notification when a critical value is reached. If you want complete security, specify what the computer should do in this case - go into sleep mode, hibernate, or completely shut down.
How to lower the temperature
If you experience overheating on a regular basis, here are some simple tips that might help you fix the problem.
The first step is to clean your PC. Excessive heat is often associated with the accumulation of dirt and dust inside the computer over the years, clogging the fans and preventing normal air circulation. When doing this, make sure none of them are blocked. Despite the simplicity of the advice, it often helps.
Hopefully this solves the problem. If not, then more serious measures are needed. If your computer is many years old, the thermal paste may have dried out. Removing the remnants of the old thermal paste with rubbing alcohol and applying a fresh coat can lower the temperature. You can easily find small syringes with thermal paste in your local stores.
If all of the above does not help, it is possible that your cooler is simply not able to effectively cool the processor. Especially if you are using some modest cooler from an independent brand in tandem with a top-end processor - and even more so if you are overclocking. It would be appropriate to buy a more powerful cooler.
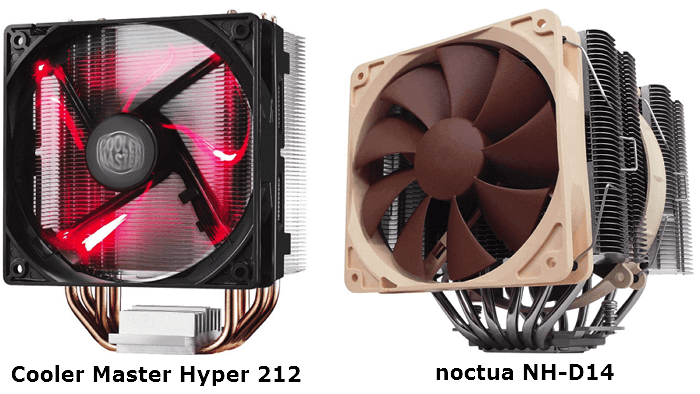
The Cooler Master Hyper 212 is a reliable and affordable option. With its large heatsink and fan, it is noticeably superior to the bundled turntables. Moving up in size and price, you come across the Noctua NH-D14, one of the most efficient coolers around. However, due to its solid dimensions, it can block access to memory, and it certainly will not fit into a small case.
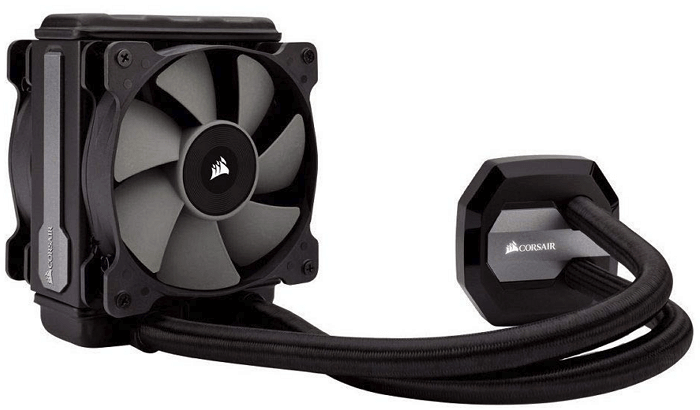
Closed-loop liquid cooling systems do their job even better. The Corsair H80i v2 is a great entry-level dropsy, but if you plan on overclocking, consider a model with a larger 240mm radiator like the EVGA CLC 240. There is more metal here, which, together with two turntables, will curb even strong overclocking.
Reobasses for RPM control
If all of the above does not suit you for some reason, perhaps one of the proposed reobases will suit you. Please note that such systems need to be installed correctly. If you are not sure that you can do this correctly, then contact the professionals for help.
NZXT Sentry

5.4-inch touchscreen panel. NZXT Sentry provides detailed system information, including CPU heating. However, the main purpose of the system is to control coolers. The system allows you to control the rotational speed of up to five coolers, which significantly reduces overheating of hardware components and the noise level.
Thermaltake Commander FT

Commander FT has an intelligent setting to automatically adjust all fans based on a temperature sensor. It can be set to maximum power or turn on silent mode. The manual mode is fully configurable and allows individual adjustment of the rotation speed, and the settings are retained even after a reboot.
Commander FT supports up to five independent coolers, each channel provides up to 10 watts of power for efficient operation of all of them. By pressing "1" to "5" on the center display, you can easily adjust the rotation speed of an individual fan.